Get unblocked instantly.
Stay in flow forever.
TierZero Internal Support Agent learns from your docs and infrastructure to respond to queries. Fewer bottlenecks, fewer context-switching, more shipping.
How it works
Ask in Slack, get answers in seconds.
Engineers ask questions directly in Slack — "How do I roll back service X?" "What's the runbook for database failover?" No context-switching, no ticket filing, no waiting for someone who knows.
Grounded in your docs, code, and live systems.
TierZero searches Notion, Confluence, runbooks, code repos, past incidents, and Slack history. But it doesn't stop at docs — it cross-references live telemetry, deployment state, and code to give answers that are actually current.
See what's working. Tune what isn't.
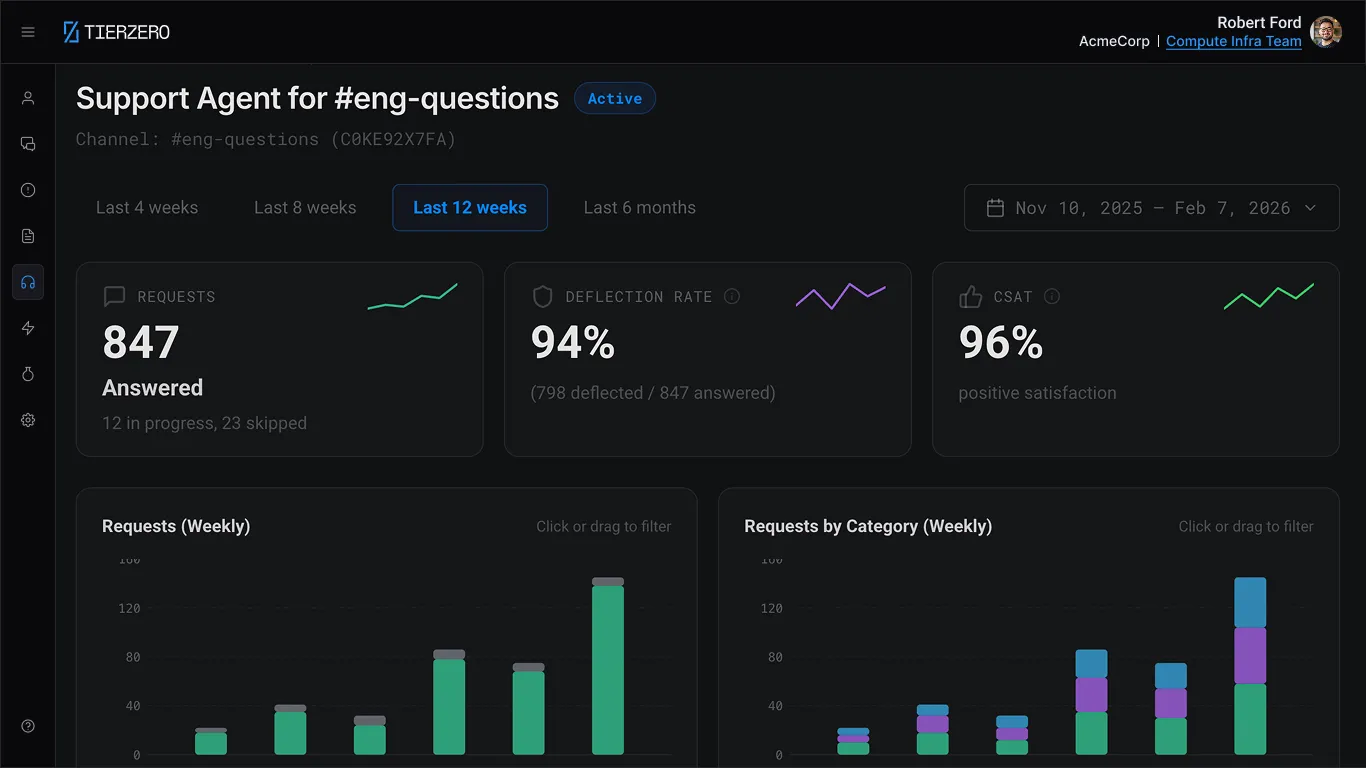
Track deflection rate, CSAT, and question categories out of the box. See which topics need better documentation, which answers get thumbs-down, and fine-tune the agent's behavior without writing code.
See what your team is really asking.
Every question is a signal. TierZero tracks what engineers ask, which topics have low-confidence answers, and where your documentation has gaps — so you can invest in the right places.
Question analytics
See trending topics, question volume, and auto-resolution rates across your team.
Knowledge gap detection
Automatically flags topics where answers are weak or missing, so you know exactly which runbooks to write.
Deflection tracking
Measure how many questions are resolved without escalating to a human — and track improvement over time.
From answers to actions.
TierZero doesn't just tell engineers what to do — it can do it for them. Define SOPs for common operations and let engineers trigger them directly from Slack with guardrails built in.
Execute common ops
Restart pods, clear caches, scale deployments, rotate secrets — all from a Slack message.
Guardrails built in
SOPs run with scoped permissions, environment checks, and audit logging. No cowboy kubectl.
Self-service at scale
Junior engineers handle routine operations safely. Senior engineers stop being a human API.
Edit Support Agent
Update the configuration for this support agent.
| 1 | ### Investigate Data/DB workload and performance |
| 2 | If user asks about slow database latency, investigate and provide reasons. |
| 3 | 1. Use {{ rds identifier }} to review CPU, connections, IOPS, and freeable memory. |
| 4 | 2. Use $performance_insights to find top queries by load and blocking sessions. |
| 5 | 3. Check recent deploys and current traffic for the affected service. |
| 6 | 4. Check Redis for anomalies (CPU, memory, evictions) and correlate with app latency/errors. |
| 7 | Escalate to @db-eng for sustained high CPU, storage pressure, or blocking writes. |
| 8 | |
| 9 | ### Stabilize Kubernetes/infra issues |
| 10 | If user asks about Kubernetes pod failures or service instability, investigate and stabilize. |
| 11 | 1. Use kubectl to identify failing pods and their nodes. |
| 12 | 2. Use kubectl to detect OOMKilled, CrashLoopBackOff, or scheduling errors. |
| 13 | 3. For stateless workloads, delete the unhealthy pod to restart; confirm rollout with "rollout status deploy". |
| 14 | 4. If pods are Pending due to insufficient resources, check cluster events; avoid changing requests/limits and coordinate capacity with platform. |
| 15 | 5. If a node is NotReady, notify platform immediately and consider opening a PD incident if impact is broad. |
| 16 | Escalate to @compute-eng for capacity/node problems and to app owners for recurring OOMs or errors. |
| 17 | |
| 18 | ### Track external provider/service incidents |
| 19 | If user asks about issues tied to a third-party provider, confirm scope and communicate clearly. |
| 20 | 1. Check $statuspage for {{ external service provider }}; note start time, regions, and affected features. |
| 21 | 2. Check for impacted apps (error rate, latency, throughput) to confirm dependency impact. |
| 22 | 3. Post an FYI in #noc with the status link and observed impact; consider temporary alert tuning only with owner approval. |
| 23 | 4. If member-facing or lasting over 30 minutes, open a PD incident and start stakeholder updates every 15–30 minutes. |
| 24 | 5. Close with a resolution update including the impact window and status link. |
| 25 | Escalate to @platform-eng and owning app teams for critical dependencies (payments, auth, voice). |
| 26 | |
| 27 | ### Triage deployment failures |
| 28 | If user reports a failed deployment or rollback, investigate root cause and restore the service. |
| 29 | 1. Check $deploy_dashboard for the failed pipeline; note the failing step, commit SHA, and error output. |
| 30 | 2. Pull recent commits from {{ service repo }} and review diffs for breaking changes. |
| 31 | 3. If the failure is a test flake, re-trigger the pipeline. If it is a real failure, revert the last merge. |
| 32 | 4. Confirm service health after rollback via $grafana and synthetic checks. |
| 33 | Escalate to @release-eng for persistent pipeline failures or infra-level build issues. |

Senior engineers got 3 hours a day back.
Questions Answered Without Escalation
Engineers get answers without pinging the on-call
Median Response Time
Versus hours waiting for a human reply